On this page, you'll find visualisations of the aggregation of multiple data layers to augment decisions about landing zones and best paths for sample collection.
This animation shows an example of two selected areas based on scientist and engineer value bids, terrain constraints, iron distribution, and water distribution. Optimised shortest path between sample zones is also demonstrated from and to landing site. This path is a starting point, and will update during each mission by encorporating data from each collection
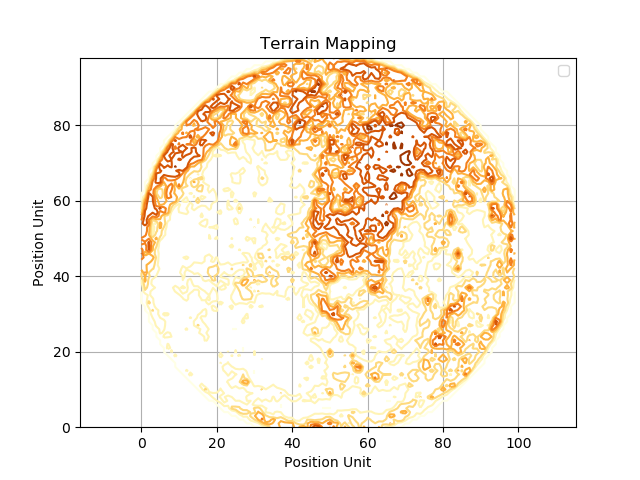
We start with terrain data, due to restrictions terrain places on rover and astronaut travel.
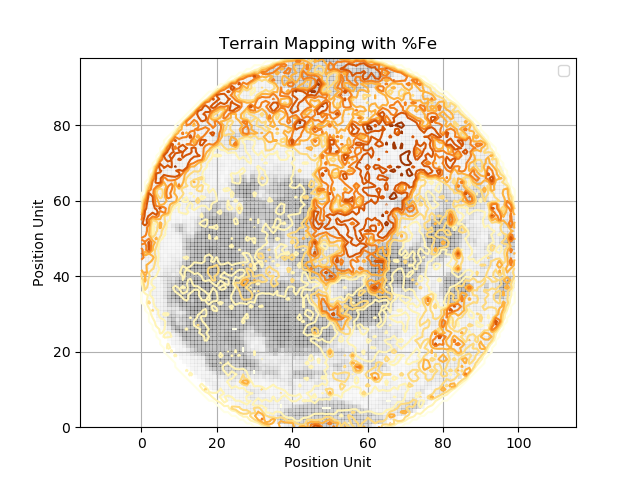
A layer of iron distribution data is then added.
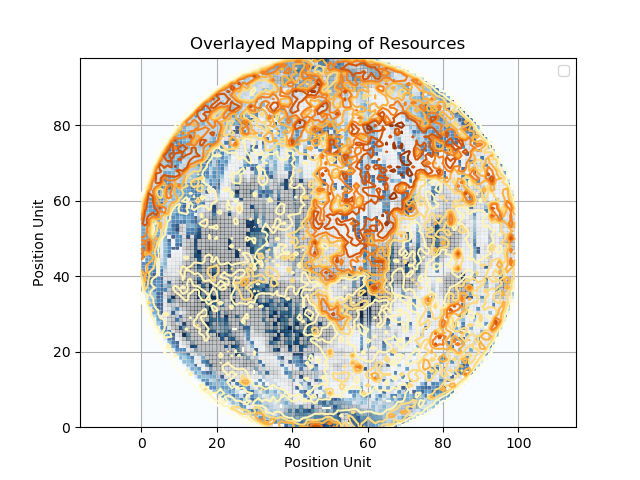
And we add to this a water distribution layer to cross-reference all three types of data. We will continue to add data layers that represent each of the weighted research interests.
3.4 Hours
18.5 Hours
Lets get in touch. Send us a message:
Brisbane, AUS
Phone (at Avestix Lab): 1300 766 261